A Closer Look at MTBF, Reliability, and Life Expectancy
November 28, 2017 by CUI Inc -
3 Minute Read
Last updated December 19, 2023

Table of Contents
- What is Reliability?
- How to Interpret MTBF and Reliability
- MTBF and Life Expectancy
- You May Also Like
Digital electronics have become ubiquitous, permeating every facet of our lives. From mobile phones and tablets, fitness monitors and home digital assistants, to Internet and telecom infrastructure, data centers, transportation management, and fly-by-wire airliners, we are surrounded by and immersed in digital technologies. This reliance has sparked a growing awareness of the issues surrounding the reliability of the electronic components used within.
Given this trend, it is not surprising that design engineers are placing a greater emphasis on reliability during the component selection process, using key data points from component vendors such as Mean Time Between Failures (MTBF) to make design decisions.
While MTBF can be a useful metric to estimate reliability, especially when comparing components from multiple vendors, the trap many people fall into is wrongly assuming that the MTBF figure directly equates to the expected life of the component. Since there are many misconceptions surrounding this topic in electronic design, it is important to revisit the link between the reliability and lifetime of electronic components.
What is Reliability?
Reliability is defined as the probability that an individual unit of the product, operating under specified conditions, will work correctly for a specified length of time. It can be expressed statistically as:
R(t) = e-λt
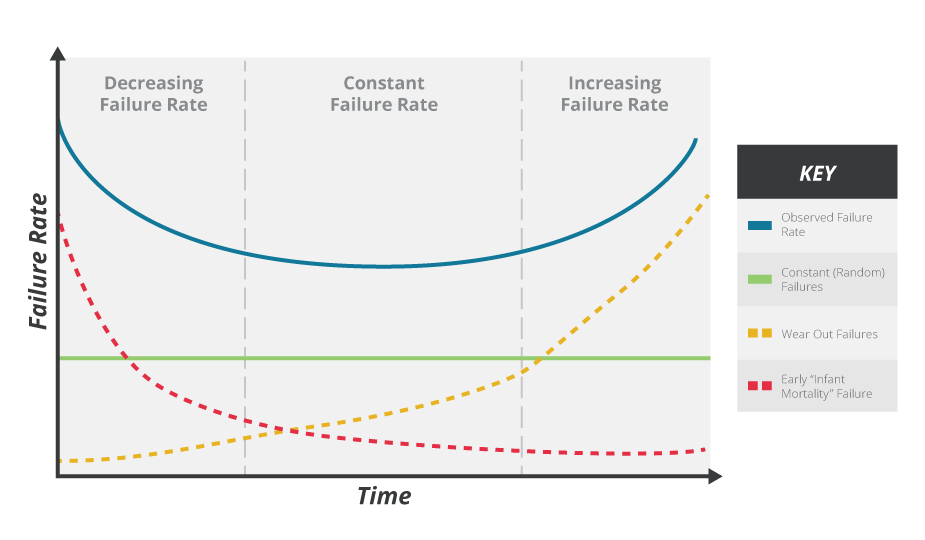
Where λ is the intrinsic failure rate, excluding early failures (infant mortality) and wear-out failures (end of life).
Hence reliability is the probability of failure in the flat central part of the familiar bathtub curve shown below.

The inverse of λ, 1/λ, gives the Mean Time To Failure (MTTF), which is more commonly expressed as the Mean Time Between Failures (MTBF), especially in the power industry. It can be tempting to believe that calculating the MTBF gives the typical expected lifetime of the product, but this is a common misconception.
How to Interpret MTBF and Reliability
Consider a component that has an intrinsic failure rate (λ) of 10-6 failures/hour. Although the MTBF is 1 million hours, the R(t) = e-λt curve, shown in the graph below, tells us that only 36.7% of units are statistically likely to operate for this long. 60.6% can be expected to operate for 500,000 hours, and further we can expect 90.5% to last for a lifetime of 100,000 hours.

With this information for each component, we must then sum the individual failure rates of all the components that make up the system to understand for how long an entire product will last (λA = λ1n1 + λ2n2 + … + λini).
Clearly, even if the majority of components exhibit robust reliability, a single vulnerable link can compromise the entire system's dependability- a system’s reliability can be no better than its least reliable component. For designers, strategically focusing on the weaker components can significantly enhance overall performance and reliability.
MTBF and Life Expectancy
The important message is while the MTBF is a trustworthy basis for analysis and comparison of products and components, it should not be interpreted as a direct expression of life expectancy.
The demand for reliability in the digital products now woven into the fabric of life and work will continue to grow. As an industry, we can help engineers enjoy a better design experience by clearly communicating on the subject of reliability, MTBF, and actual life expectancy as it relates to our products.
You May Also Like
Have comments regarding this post or topics that you would like to see us cover in the future?
Send us an email at powerblog@cui.com


